monitor_mockup@4x

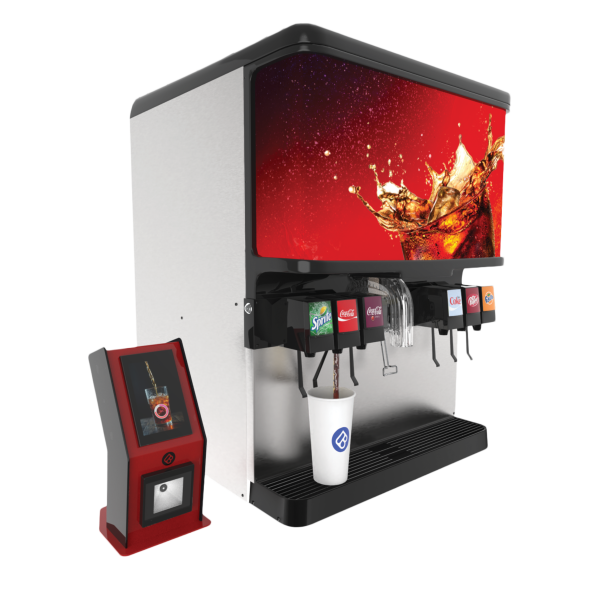
QR-Controlled Self-Pour Soda System

Stop Theft with a QR-Controlled Self-Pour Soda Setup

monitor_mockup@4x

Reclaim Your Margins

Stop Theft with a QR-Controlled Self-Pour Soda Setup

Stop Theft with a QR-Controlled
Self-Pour Soda Setup

THE PROBLEM

Soda Shrinkage Is Real—And It’s Costing You

Traditional soda setups lose revenue. Here’s why:

15–30% shrinkage industry-wide (soda poured vs. soda sold)

Lost revenue from unlimited freerefills vs. capped, shared cups, andno-purchase pours - people that geta water cup and pour fountaindrinks

No visibility into what’s actuallybeing dispensed

Consider this example:

A typical quick-service restaurant couldlose $100–$200 in soda revenue duringlunch alone.

Over a month, that adds up to $6,000–$12,000—or as much as $144,000 annually perlocation in potential lost revenue.

With profit margins as high as 85–90% on soda, even small losses add up fast.

THE SOLUTION

QR-Controlled Self-Pour Soda

Guests simply scan a QR code to activate the soda dispenser. Each scan is securely tied to a:

•   Purchase
•   Configurable time limit
•   And set volume cap

Whichever is reached first stops their ability to pour

HOW IT WORKS

No purchase? No pour. Simple. Secure. Profitable.

No purchase? No pour.
Simple. Secure. Profitable.

How Self-Pour Soda Systems Work. No purchase? No pour. PourMyBeer’s QR Controlled Soda System is simple, secure, and profitable.

Key Benefits

Icons/Outlined/maintenance Copy 3

BENEFIT 1

Eliminate Soda Theft

No more unmonitored refills or shared cups.

BENEFIT 2

Pour Visibility

Get full visibility into pours and shrinkage.

BENEFIT 3

Free Up Your Staff

Reduces staff oversight and policing.

Group

BENEFIT 4

Real-Time Reporting

View poured vs. sold metrics inside your PourMyBev dashboard.

BENEFIT 5

Reclaim Thousands in Lost Revenue

Eliminate profit leaks and maximize high-margin soda sales.

BENEFIT 6

Easy Integration

Add soda to your existing PourMyBev setup—no new system required. Works with most Lancer-style machines using just one screen per unit.

Visualizing the Impact

Soda Dispensed vs. Soda Paid For*

Month

Soda Dispensed (Gal.)

Paid For (Gal.)

Shrink %

Estimated Lost Revenue

Jan

500

400

20%

$2,250

Feb

520

415

20.2%

$2,362

Mar

480

390

18.8%

$2,025

Month

Soda Dispensed (Gal.)

Paid For (Gal.)

Shrink %

Estimated Lost Revenue

Jan

500

400

20%

$2,250

Feb

520

415

20.2%

$2,362

Mar

480

390

18.8%

$2,025

*Based on $2.50 avg. drink, 16 oz servings, and 85% profit margin.

Ready to Stop Losing Thousands?

Lock down your soda revenue,delight guests, and protect yourmargins.
Get in touch today!

* Required fields