Understanding restaurant industry metrics might help you increase your profits. Key performance indicators for restaurants, or KPIs, show financial success measurably and tangibly. Performing a restaurant KPI health check is crucial to quantify your performance and discern what changes you need to make. Read on to learn about 25 KPIs and how to calculate them.
25 essential Bar and Restaurant Metrics
- Cost of Goods Sold
- Labor Cost Percentage
- Prime Costs
- Break-Even Point
- Food Cost Percentage
- Contribution Margin
- EBITDA
- Gross Profit & Gross Profit Margin
- Inventory Turnover Ratio
- Menu Item Profitability
- Net Profit Margin
- Overhead Rate
- Average Customer Headcount
- Employee Turnover Rate
- Revenue Per Available Seat Hour
- Revenue Per Square Foot
- Table Turnover Rate
- Time Per Table Turn
- Customer Acquisition Cost
- Customer Retention Rate
- Beverage Loss
- Food Loss
- Tips From Total Collected
- Complaints Per Restaurant Order
- Sales Per Staff Member
To learn about cost analysis and budgeting from an industry expert, check out the video below. Jim Wright, Director of Operations at four self-pour venues, discusses key performance metrics and gives advice to meet your goals.
1. Cost of Goods Sold
Also known as the cost of sales, the cost of goods sold (CoGS) includes any direct costs and expenses related to producing goods intended for sale. This broad category fits material and labor costs, but not indirect costs like distribution, overhead, or marketing. The CoGS formula is as follows: Beginning Inventory + Purchases During the Period – Ending Inventory.
The beginning inventory includes any merchandise carried over from the previous year. You’ll add any new purchases. Then, at the end of the year, you’ll subtract any unsold merchandise, which will become next year’s beginning inventory. You can deduct the resulting number from your revenue to find your gross profit. You can read more about gross profit metrics in section 8 of this article.
2. Labor Cost Percentage
If you want to optimize your profit margins, you may need to reduce labor costs compared to other expenses. You can determine your labor cost percentage using the following formula: (Labor-Related Costs ÷ Gross Sales ) × 100%.
Labor costs tend to be among the highest expenses for a restaurant, accounting for an average of 20 to 30% of all restaurant industry costs. It’s smart to set aside a significant portion of your funds for labor, especially with increasing demands for a higher federal minimum wage. But it’s not just about keeping costs low; it’s about investing in your team. High labor costs could indicate that you’re overstaffed, but they could also mean that you’re providing your employees with competitive wages and benefits, which can lead to lower turnover and higher customer satisfaction.
Furthermore, understanding your labor cost percentage can help you make informed decisions about scheduling. For instance, if your labor cost percentage is high during certain times of the day or days of the week, you might consider adjusting your staffing levels to better match customer demand.
3. Prime Costs
Prime costs are the backbone of your restaurant’s financial health, encompassing both the CoGS and labor costs. But it’s more than just adding these two figures. Understanding your prime costs can help you identify inefficiencies in your operations. For instance, if your prime costs are too high, you might need to adjust your menu pricing or portion sizes or find ways to reduce waste. On the other hand, if your prime costs are lower than industry averages, it might be an opportunity to invest in quality improvements or staff training, enhancing your restaurant’s overall value proposition. The prime costs equation is simple: Raw Materials + Labor.
Finding each product’s prime cost ensures you have a profit margin in your sales price. Note that raw materials refer to the product’s physical components, such as metal, plastic, or fabric. For a restaurant, raw materials include all food and beverage items within the menu. The direct labor costs include wages paid to those who assemble or create products — this does not include concept designers, engineers, or factory managers. It only encompasses those who work hands-on in the product’s creation.
4. Break-Even Point
Another crucial metric to consider is the break-even point, or when your revenues equal your costs.
Knowing your break-even point is crucial for planning and forecasting. But it’s also a valuable tool for setting goals and motivating your team. By breaking down the break-even point into daily or weekly targets, you can give your staff a clear goal to strive for and a tangible measure of their success.
This formula allows you to determine when your company or one of your products will become profitable. If your revenue does not reach the break-even point, you’re operating at a loss. You can calculate the break-even point for a specific product with this formula: Fixed Costs ÷ (Sales Price Per Unit – Variable Costs Per Unit).
Fixed costs include any expenses that do not vary, such as rent and utilities. The sales price per unit is how much you plan to charge for the product in question, and the variable costs per unit are any costs involved with producing that product.
5. Food Cost Percentage
Like the labor cost percentage, the food cost percentage shows you how much of your funds you spend on food supplies. Knowing the ratio between the cost of ingredients and the revenue they generate will help you determine the best possible menu prices.
You’ll need to determine the total cost of ingredients per serving. For instance, if you buy five pounds of ground turkey for $20, the eight ounces you use for one turkey burger costs you $2. Add the expenses of all the plate’s ingredients to find the total cost per serving. If you source high-quality, expensive ingredients, you can justify setting higher menu prices.
Use this formula to find your total food cost percentage: {(Beginning Inventory + Purchases) – Ending Inventory} ÷ Total Food Sales.
A desirable food cost percentage depends on the industry sector to which your restaurant belongs. Fast food restaurants have lower food cost percentages than fine-dining restaurants. You can find your ideal food cost percentage by dividing your total food costs by your total food sales. Then, compare this number to your actual food cost percentage and the industry averages. Doing so will help you determine if you should adjust your menu prices or source cheaper ingredients.
6. Contribution Margin
Your contribution margin indicates how much your selling price exceeds your total variable cost per unit. It’s how much each unit puts toward covering your fixed costs. In other words, this shows you how much each menu item contributes to paying your bills. You can find the contribution margin for a single unit like this: Contribution Margin Per Unit = Sales Revenue for an Item – Variable Costs for That Item.
Let’s say it costs $10 to create one of your menu items and you sell that item for $15. Its contribution margin is $5. After fixed costs, any money remaining from the margin is the item’s profit. Remember, variable costs should not include any fixed expenses, like rent or utilities. You can also use this formula to find the total contribution margin your company earns as a whole.
You’ll need to adjust the formula as follows: Total Sales Revenue – Total Variable Costs.
If you find your margin is negative or slim, you can remedy this issue by reducing your variable costs or increasing your product prices. For example, if you find you’re spending $100 on variable costs for ingredients each week but only earning $90 in sales revenue, you might want to seek different vendors or tweak the prices on your menu. It’s crucial to figure this out early on before net losses become a threat.
7. Earnings Before Interest, Taxes, Depreciation and Amortization
You may also want to find your earnings before interest, taxes, depreciation and amortization, or EBITDA. This metric allows you to compare your revenue against your operating costs while excluding other financial considerations. It shows your profitability before other operating expenses — in that way, it shows how well your restaurant is performing. However, it gives you an idealized picture, and you should not use it to make major financial decisions. Instead, use it to evaluate how well your business model is working.
This metric excludes interest. Interest and debt can help you determine your creditworthiness, but it does not show how well your business is performing. EBITDA also excludes taxes. Since taxes vary based on location, a less profitable restaurant may seem to have better performance when, in reality, they pay lower taxes.
It also excludes both depreciation and amortization. Depreciation is an essential factor in helping you determine when you need to replace equipment, such as ovens and grills. However, it does not indicate how well your restaurant is performing. Amortization has to do with your company debt, which is also irrelevant for measuring performance.
8. Gross Profit and Gross Profit Margin
Gross profit and gross profit margin help you measure your restaurant’s profitability using your income statement. Gross profit is how much money your company earns after subtracting production and selling costs. You can find it with this formula: Gross Profit = Net Sales — CoGS.
You can find the formula for CoGS in the first section of this article. The term “net sales” refers to revenue or the amount of money you’ve generated from sales in a given period. Gross profit is a whole number, while the gross profit margin is a percentage. You can find your gross profit margin using the following formula: (Revenue – CoGS) ÷ Revenue.
The resulting percentage tells you how much your revenue exceeds your costs of production. The higher this percentage, the better. A larger percentage means you’re selling your inventory for a higher profit. For example, in 2017, Apple saw a gross profit margin of 38%. The company earned $229 billion in revenue with a CoGS of $141 billion.
9. Inventory Turnover Ratio
Your inventory turnover ratio helps you determine your restaurant’s overall efficiency. In general, a higher inventory turnover rate shows improved performance. If you’re buying too much inventory, you may be wasting funds — this is especially true for the hospitality industry, in which food inventory is perishable. A faster turnover rate can decrease storage expenses. You can determine your restaurant’s inventory turnover rate with this formula: Inventory Turnover Ratio = CoGS ÷ Average Inventory.
It’s essential to use your average inventory, as it accounts for merchandise fluctuation throughout the year. To find your average inventory, use this equation: (Beginning Inventory + Ending Inventory) ÷ 2.
You’ll want to be careful to maintain a high turnover rate without allowing your inventory to fall too low. Of course, it’s best to have all the ingredients you need to make every item on your menu, even if that means occasional overstocking. Otherwise, you’ll have dissatisfied customers whose menu choices are unavailable.
10. Menu Item Profitability
Every restaurant owner should understand menu item profitability, which is a vital restaurant marketing KPI. You’ll want to sell items that offer a high profitability margin. You can compare the profitability of one menu item against others by looking at their contribution margins. First, you’ll need to find the contribution margin for the menu item in question. Then, you’ll find the average contribution margin (ACM) by taking the total contribution margin and dividing it by the total number of items sold.
Individual menu items should have contribution margins equal to or greater than the ACM. A number below the ACM will indicate one of your least profitable menu items. Remember, desserts and appetizers cost less and often have lower contribution margins. However, they still increase profitability because they have low production costs.
11. Net Profit Margin
Net profit margin is essential to consider, as it shows how much of your sales is actual profit. Because it accounts for all costs and revenue, it’s an excellent performance metric. Use this formula to find net profit margin: (Your Total Revenue – Your Costs) ÷ Your Total Revenue × 100.
You can find your total revenue by multiplying the number of units sold by the cost per unit. To find your total costs, add your CoGS and your fixed costs, including operating expenses and taxes. Knowing your net profit margin can help you qualify for loans, forecast your profits and make crucial business decisions.
12. Overhead Rate
Your overhead rate helps you understand your indirect costs or costs that do not generate revenue. Such costs might include:
- Rent
- Utilities
- Equipment
- Insurance
- Maintenance
- Taxes
- Advertising
To find your overhead rate, you’ll use this equation: Indirect Costs ÷ Activity Driver.
An activity driver is anything that influences the cost of operation. You might choose to compare any activity driver, including labor, sales, or machine hours. This formula will show you a dollar amount — if you’d like to see your overhead rate as a percentage, you can multiply the activity driver times 100.
13. Average Customer Headcount
Your average customer headcount shows how many customers you’ve served during a specific period to help you gauge your restaurant’s popularity. It can also help you anticipate your slow and busy times, so you can better plan your schedule and inventory.
Be sure to keep track of how many customers you serve, so you can calculate your average customer headcount. You can find your average monthly headcount by adding together the headcount for each month and dividing by the number of months.
14. Employee Turnover Rate
Your restaurant’s employee turnover rate is one of the most significant restaurant staff KPIs. It measures how often employees leave your staff, including dismissals, resignations, and retirement. It does not include any internal moves, such as promotions or transfers, as you’ve retained those employees. If your turnover rate is high, you may need to rethink your workplace culture or change your hiring practices.
Employee turnover rates of bars and restaurants are notoriously high. It’s an issue deserving serious consideration, as having to hire and train new employees puts a lot of financial strain on your restaurant.
The formula for finding your employee turnover rate is simple: (Employees Departed ÷ Number of Employees) × 100.
15. Revenue Per Available Seat Hour
You may want to consider the revenue of each seat in your restaurant. You can find this by calculating the revenue per available seat hour (RevPASH). This formula shows you how much money you earned per seat in a given amount of time. Use this equation to find your RevPASH: Total Revenue ÷ (Number of Seats in Your Restaurant × Number of Hours You’re Open).
To illustrate this formula, let’s say your restaurant earned $10,000 in sales last night with 100 seats open over six hours. Your RevPASH would be: 10,000 ÷ (100 × 5) = $20.
You can improve your RevPASH by increasing your table turnover rate, which you can read more about below.
16. Revenue Per Square Foot or Sales Per Square Foot
As you can guess, revenue per square foot, or sales per square foot, is another way to conceptualize your revenue. It helps you determine sales efficiency. Its formula is Revenue ÷ Retail Space.
Retail space is anywhere you make sales. The higher the sales per square foot, the more efficient your space is. If you want to increase your revenue per square foot, you might consider upgrading your menu or investing in enthusiastic waitstaff. You might also run campaigns advertising popular menu items.
17. Table Turnover Rate
As mentioned above, the table turnover rate is another essential metric for any restaurant. It refers to how many parties you serve compared to how many tables you have. Fast food restaurants tend to have high table turnover rates, with their quick food preparation and on-the-go customers. On the other hand, fine dining establishments tend to have low turnover rates, as they take more time preparing food and offer guests several courses. Self-serve establishments tend to have a high turnover rate as customers are served significantly faster and never have to wait for a drink!
As a rule of thumb, if you sell inexpensive food, you’ll want to serve as many customers as possible. If you serve pricier food, you can take your time catering to each guest. You can calculate your table turnover rate with this formula: Number of Parties Served ÷ Number of Tables.
18. Time Per Table Turn
Similar to the table turnover rate, the time per table turn shows you the average time guests stay at a table. This figure helps you understand how long your customers spend in the restaurant on average. A lower time per table turn means you can seat more customers, while a higher number means you can sell multiple courses.
Knowing this figure will allow your hosts to offer more accurate wait times, which will make for happier customers and less stressed staff. You can find your time per table turn by keeping track of the time differences between when the servers first take orders and when the tables cash out.
19. Customer Acquisition Cost
Your customer acquisition cost (CAC) shows you how much you have to spend to bring in one new customer. It includes marketing and sales-related expenses, like advertising, inventory, overhead, and other costs. Use this equation to find your CAC: (Marketing Costs + Sales Costs) ÷ Customers Acquired.
Be sure to use numbers from within the same period — for instance, if you’re calculating marketing costs from April to May, only add customers from that same span of months. Compare the figure after trying different marketing strategies to help you get a feel for which are most effective. Remember, seasonal changes beyond your marketing efforts may also impact customers acquired.
20. Customer Retention Rate
As capacity restrictions begin to ease and more customers come through your doors, it’s important to prepare your establishment for the post-COVID rush. Check out these 19 tips to get your establishment ready!
21. Beverage Loss
Beverage loss is an essential taproom KPI, affected by theft, over-pouring, and breakage. When you factor in your beverage loss, you’ll find your drinks are not as profitable as they could be. If your beverage loss is 20%, you can expect to lose the cost of one beer for every five you buy, which adds up to a lot of lost funds.
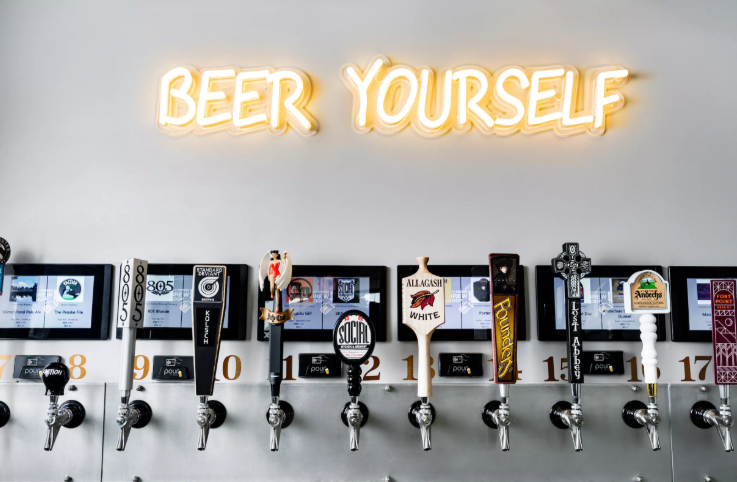
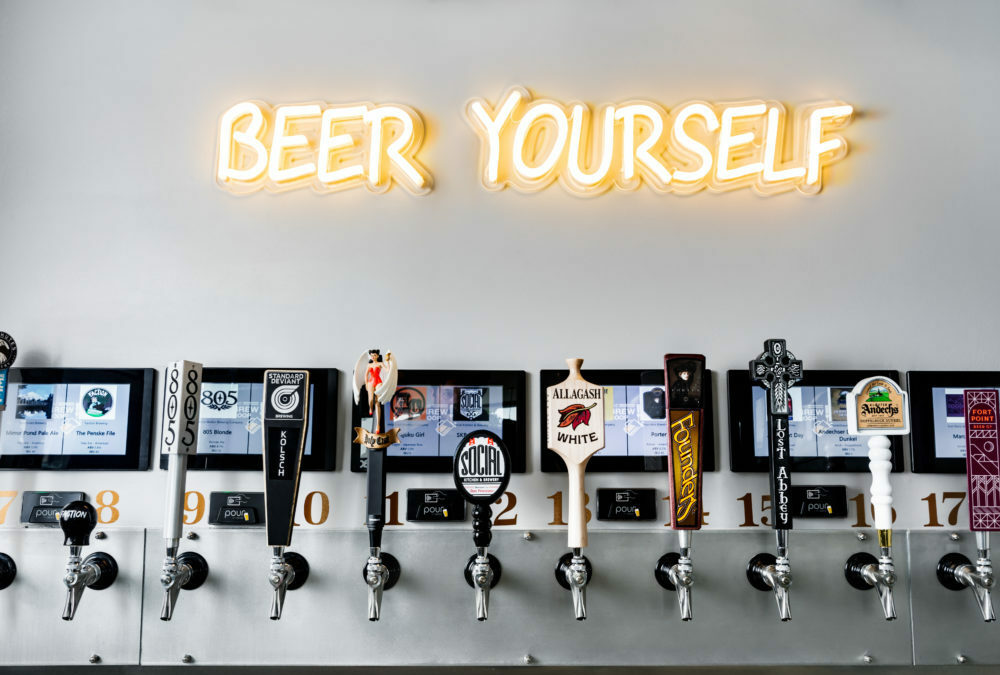
You can reduce your pour costs by increasing drink prices or using a self-pour technology system. Customers pay by the ounce, and the automated system eliminates over-pouring. This technology minimizes your beverage loss and decreases your reliance on labor.
22. Food Loss
Like beverage loss, food loss is a severe concern for any restaurant. You lose the cost of any food sent back to the kitchen or otherwise refunded. You also lose the cost of any discarded ingredients. You can find your food loss metric with this formula: (Beginning Inventory + Purchases – Ending Inventory) ÷ Food Sales.
Always keep detailed records of how much you spend on inventory, how much you sell, and how much food you discard. Food waste affects your bottom line and represents a genuine environmental concern — if you can decrease your food waste, you can become a more eco-friendly establishment.
23. Tips From Total Collected
It’s critical to know how much your servers are earning in tips for legal and tax purposes. You have a responsibility as an employer to report cash tips to the IRS. Be sure to keep track of your servers’ tips. Remember, a tip has to fit specific criteria. The customer must offer it free of compulsion, determine the amount and have the freedom to decide who receives the tip. Based on that definition, an automatic gratuity is not a tip.
24. Complaints Per Restaurant Order
Another crucial performance metric for restaurants and bars is the number of complaints per order. Complaints, as unwanted as they may be, are valuable. Most unsatisfied customers will not leave any comments — instead, they’ll quietly decide not to return. Complaints help you understand how you can improve as a restaurant. You may want to incentivize completing surveys by offering a chance at a prize to encourage more reviews.
Always keep track of complaints and divide them against your total number of customers at the end of a given period. Then, you’ll be able to see how many complaints your restaurant receives relative to your customer headcount. Be sure to mark down the nature of complaints to see where you may need to focus your effort.
25. Sales Per Staff Member
Sales per staff member or revenue per employee indicates employee effectiveness. If you find this number lower than you’d like, you might need to encourage your waitstaff to push menu items. You could promote sales by creating an employee of the month program or otherwise rewarding those who generate the most revenue. You can find this metric with this formula: Net Revenue ÷ Average Number of Employees.
Improve Your Beverage Loss Metrics With PourMyBeer
As you measure the above metrics, you may find room for improvement. While researching strategies to optimize your KPIs, you might consider installing a self-pour system. With a PourMyBeer system in your bar or restaurant, you can improve several metrics. You’ll decrease your beverage loss KPI, reduce your labor cost percentage, and encourage customer satisfaction.
Customers will be able to taste beers and refill their glasses on their own, without waiting for an available bartender. They’ll have fun with the experience while eliminating server error and paying for every ounce they pour.


