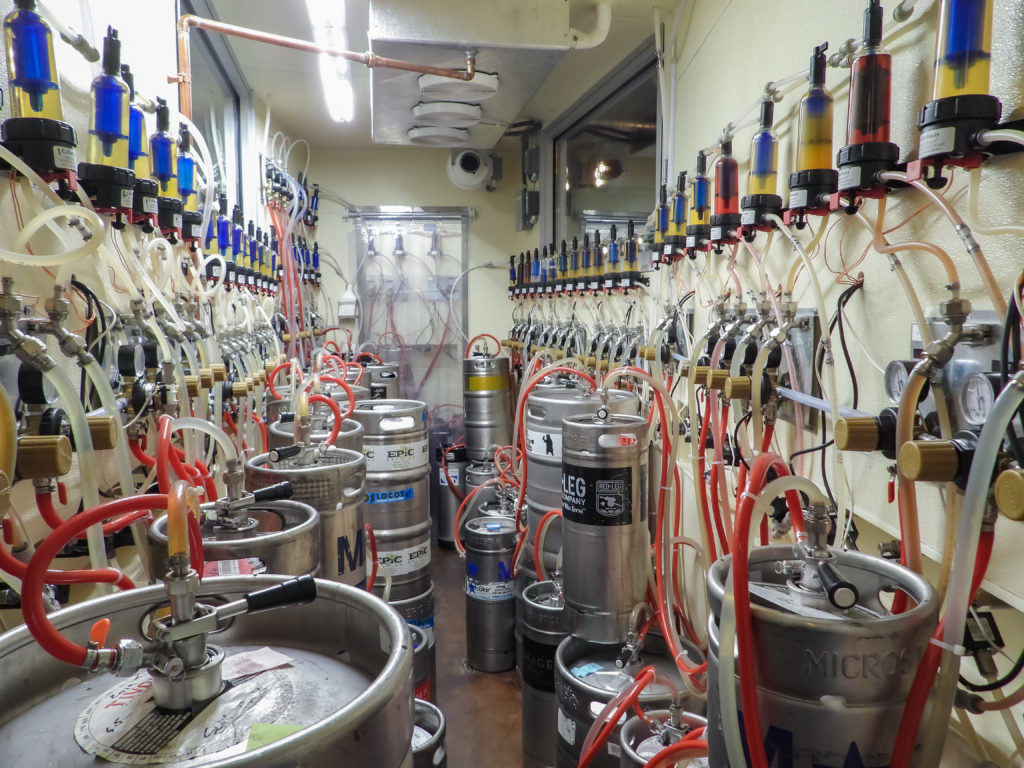
What are Key Performance Indicators?
Investopedia defines Key Performance Indicators, or KPIs, as a set of quantifiable measurements used to gauge a company’s long-term performance.
Depending on your type of establishment, not all bars will use the same KPIs to determine success.
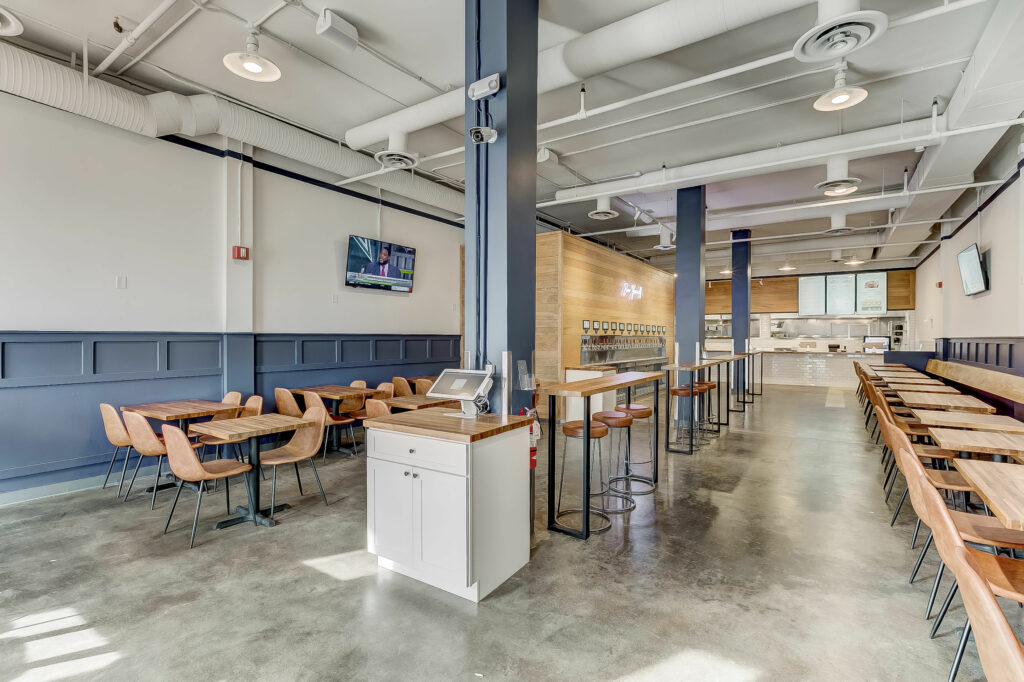
For example, Auggie’s Draft Room is a big spot for vacationers visiting from around the world. Thus analyzing their customer retention rate doesn’t make sense like it would for a bar with a majority of regulars as their customer base.
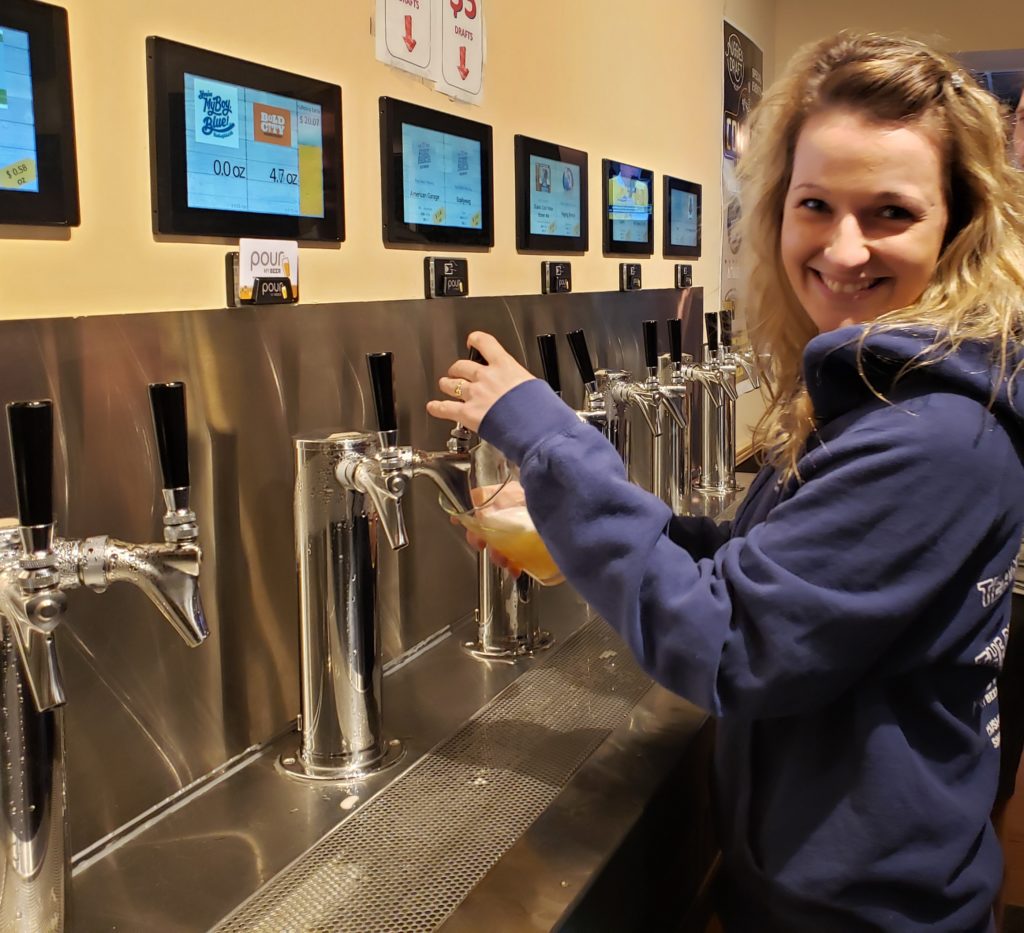
Auggie’s Draft Room, FL
Why Are They Important?
Key Performance Indicators are crucial to help you determine where your business is succeeding and what areas need work. They’ll help you see where you are spending too much money and allow you to make adjustments to track and achieve your goals. Toast’s 2017 Restaurant Tech Report states that 48% of restaurant owners analyze KPIs daily, but, with PourMyBeer operators, this number is even higher.
Let’s look at some of the most important KPIs within the restaurant industry.
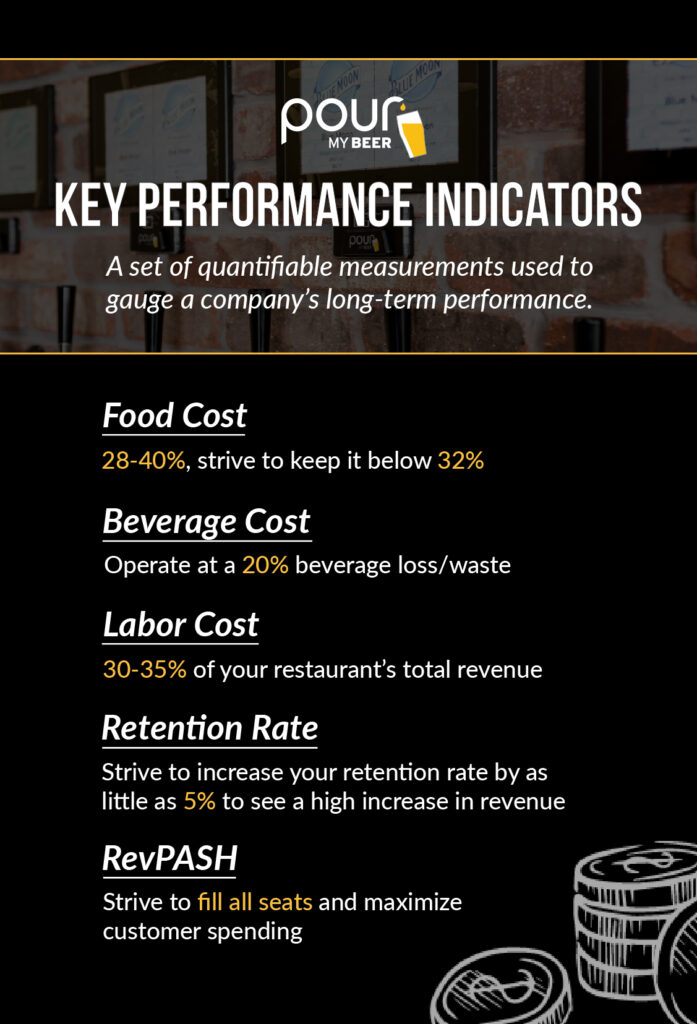
What are Some of the Most Common KPIs in the Restaurant and Bar Industry?
What are Some of the Most Common KPIs in the Restaurant and Bar Industry?
Food Cost
According to Toast’s 2019 Restaurant Success Report, 52% of restaurant owners said Food Costs are a big challenge to calculate. Simply put, food cost is the ratio between how much your food costs you in the ingredients to make your dish and how much revenue you generate from this menu item. In most restaurants, food cost falls between 28-40%, but you should strive to keep it below 32%.
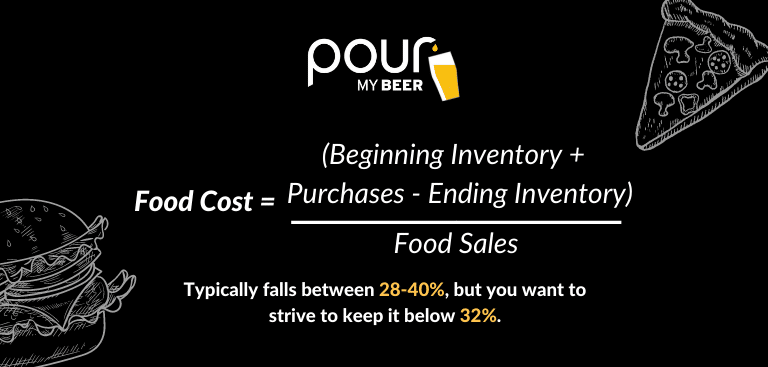
How To Calculate Food Cost
- List your food supplies received at the beginning of each week.
- Calculate the dollar amount of each item and find the sum.
- If you made any other purchases during the week make sure to include those as well.
- At the beginning of the next week, track your inventory again.
- Calculate Food Cost for the week using this formula: Food Cost Percentage = (Beginning inventory + Purchases – Ending Inventory) / Food Sales
Beverage Cost
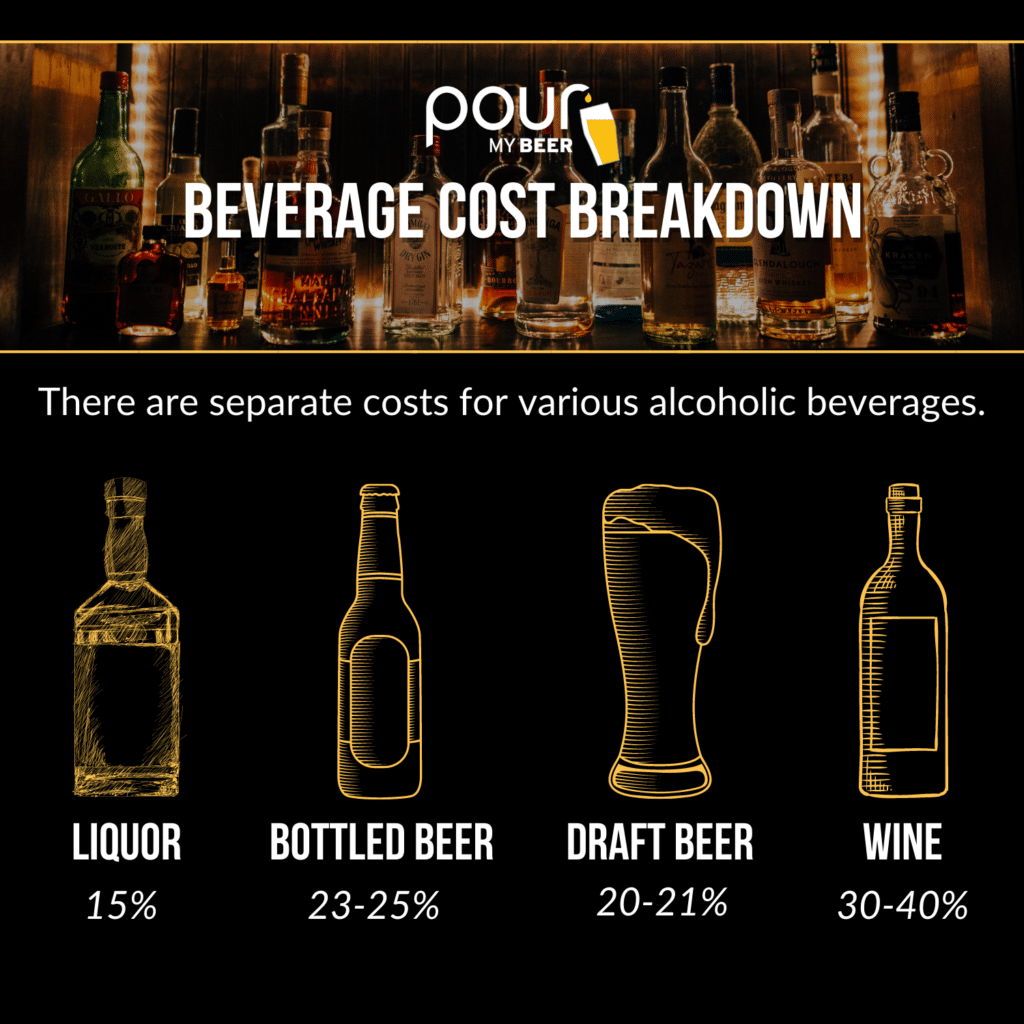
Often, bars lose money on over-pouring, free samples, and spillage, causing them to lose a chunk of their profits. Self-pour technology eliminates this as every ounce is tracked and accounted for. It is common for most bars and restaurants to operate at a 20% beverage loss/waste. Yet, there are separate costs for various alcoholic beverages. Liquor is typically around 15%, bottled beers are between 23-25%, draft beer should make up 20-21%, and wine should be around 30-40%. Unfortunately, particularly with wine in bottles, the waste is incredibly high because once the bottle is opened, it doesn’t last too long.
However, self-pour taps offer a great solution to this wastage. But, what exactly are the reasons why self-pour taps are more sustainable?
- Pay-Per-Ounce – Our system tracks every beverage in real-time so that customers pay for exactly how many ounces they pour. This results in less than 3% waste.
- No Oxidation – With self-pour wine on tap, no oxidation occurs, meaning all kegged wine will taste just as fresh on Day 40 as it did on Day 1.
- Simplified Inventory – No bottles mean less hassle. You only have a few kegs to maintain rather than hundreds of bottles (think about all of that reduced waste).
- Environmental Impact – With the reduction of bottles, you’ll significantly reduce your carbon footprint.
How To Calculate Beverage Cost
- Beverage Cost = Cost of Goods Sold / Total Alcohol Sales
- Total COGS (anything that goes into making the drink – straws, mixers, garnishes) = Beginning Inventory + Purchases – Ending Inventory
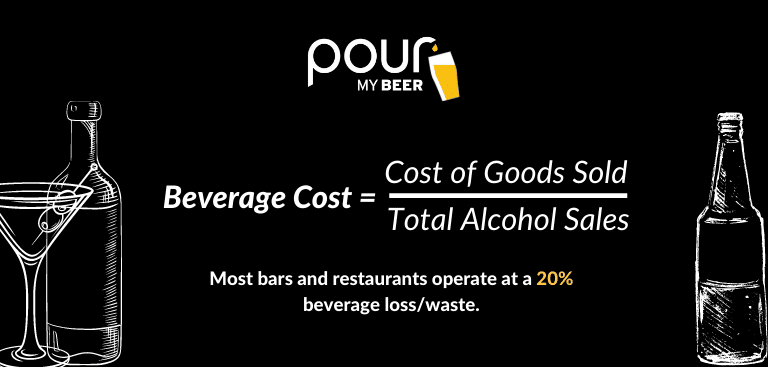
Calculating beverage costs helps you see if your restaurant is profitable. Be strategic about your drink prices as you can make “easier” money from drinks than with food.
Learn how self-pour tech can reduce your beverage cost
With a traditional bar, up to 25% of a keg gets lost from free samples or spillage. A self-pour beverage setup eliminates product waste to as little as 2-3%. For more information on how self-pour can reduce your beverage cost, get in touch with us below!
Labor Cost
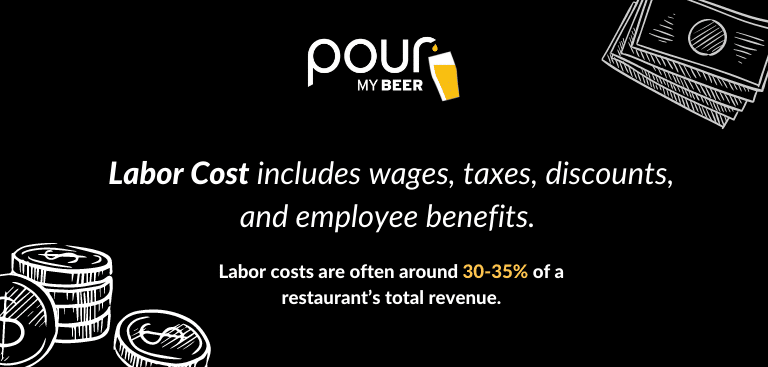
Labor Cost includes wages, taxes, discounts, and employee benefits. According to Chron, labor costs are often around 30-35% of a restaurant’s total revenue. But, this will change depending on the type of bar or restaurant. For example, a self-pour restaurant with fewer servers and bartenders will have a much lower labor cost.
How To Calculate Labor Cost
- First, calculate Gross Pay which equals Pay Rate/Hr x Gross Hours (# of hours per week x 52 weeks)
- Second, calculate Hours Not Worked and Net Hours Worked.
- Hours Not Worked = Days Missed x Hours in Shift
- Net Hours Worked = Gross Hours – Hours Not Worked
- Next, you’ll need to add in other expenses (i.e. insurance, taxes, overtime, benefits, and supplies).
- Then, when you add up the additional expenses, you need to find Annual Payroll Labor Cost which equals Gross Pay + Other Additional Expenses.
- Finally, to find their Actual Hourly Labor Cost with these extra expenses, you will divide Annual Payroll Labor Cost by Net Hours Worked.
Many bar and restaurant operators use scheduling software (i.e., HotSchedules or 7Shifts) to help them keep track of their employee’s hours. This saves them a headache when trying to find Labor Costs down the road.
Retention Rate
Your Customer Retention Rate measures your bar or restaurant’s ability to keep customers coming back through your doors. This is an important KPI to analyze. It’s ideal for restauranteurs to make sales with returning customers since the cost of acquiring new ones is higher.
How To Calculate Retention Rate
- Retention Rate = ((Number of Customers at the End of Period – Number of New Customers Acquired During that Period) / Number of Customers at the Start of Period)) x 100
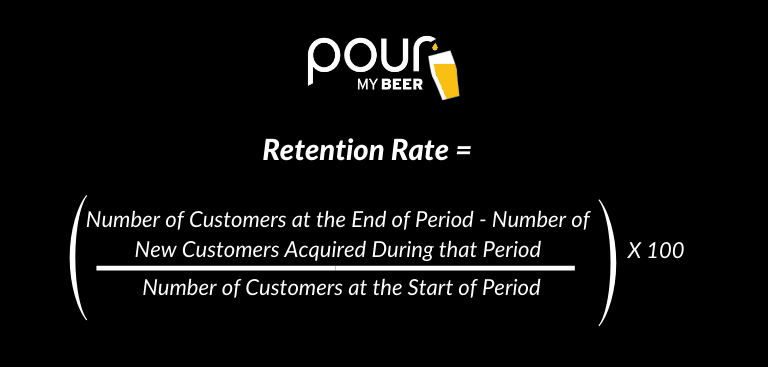
Some ways to increase your retention rate include loyalty programs, special promotions, and online marketing. Remember that growing your retention rate by even 1-5% could drastically increase your profits.
RevPASH
Also known as Revenue Per Available Seat Hour, this metric allows bars and restaurants to optimize their staffing schedule, plan what food to buy, and help increase table turn times. Once you determine your RevPASH, you will be able to determine the best time to turn your tables.
How To Calculate RevPASH
- RevPASH = Total Revenue / (Available Seats x Operating Hours)
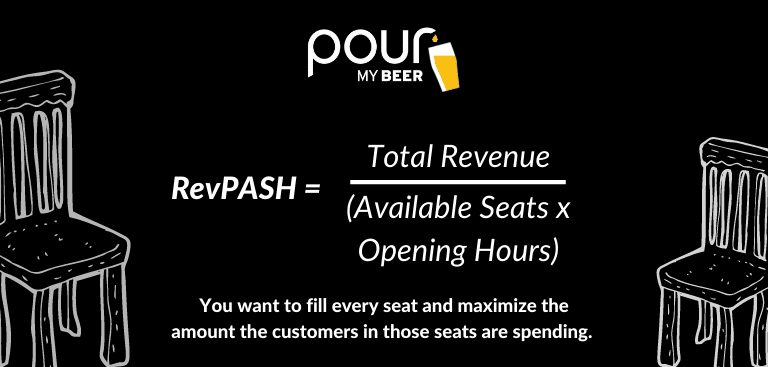
You will also want to calculate your Table Turnover Rate, which equals the Number of Parties Served divided by the Number of Tables. As a restaurant operator, you want to fill every seat and maximize the amount the customers in those seats are spending.
Hear Right From the Operators
As mentioned above, KPIs vary from business to business. So, we spoke with operators of self-pour businesses who all have different business models. Below, you’ll hear each of their takes on the most important KPIs for their establishments.
Community-Based Brewery
Greg Lamacki, Owner of District Brew Yards in Chicago, IL. You will hear him discuss KPIs at 20:10 in his Fireside Chat.
Greg's Key Takeaways:
- Have an easy-to-understand dashboard! Through their integration with Toast, District Brew Yards has 9 separate indicators that are shown in a visual graph form.
- The dashboard is given to the management team every Monday.
- Analyze the percentage of food sales, catering sales, how many 6 packs of beer are sold.
- Most important KPI for District Brew Yards: the percentage of Returning Customers; they want people in their rewards program to make up at least 10% of sales, and they want to grow the rewards program by 75 members a week (which they successfully continue to do).
Fast Casual, Family-Friendly Restaurant
Jim Wright, Owner of Stanley Beer Hall in Aurora, CO. You will hear his take on KPIs at 17:36 in his Fireside Chat.
Jim's Key Takeaways:
- Take into consideration when you’re having slow days as the numbers are easily skewed.
- Track guest count over time and look at every particular day of the week for the last couple of months to see if there was anything odd happening (i.e. bad weather).
- Look at the same day of the week from the same week number in the previous year to see what the trends were.
- It’s hard to analyze your numbers compared to somebody else. You have to analyze how it pertains to your business.
- Per client average is erratic as the number of customers is not consistent because people can go on the same tab when they come in.
- Most Important KPI for Stanley Beer Hall: Revenue/number of tickets = Total Check Average.
Fast-Casual, Touristy Restaurant
John Felico, Owner of Auggie’s Draft Room in St. Augustine, FL. You will hear his most important KPIs at 38:28 in his Fireside Chat.
John's Key Takeaways:
- Look at your product cost, which should run at 26-27%.
- Auggie’s does not look at repeat customers as they are a vacation spot, and this KPI wouldn’t make sense for their location. This is an important consideration for any business in a touristy area.
- Being involved with the customers positively impacts their average spend.
- They are an open book with their KPIs – they post what sales were each day of last year. It becomes a competition, and it gets the staff excited.
- Look at overall sales and compare them to last year.
- Most Important KPI for Auggie’s: The Ticket Average is crucial. Do anything to get your customers to spend $1 more than they normally would.
- Have someone stand at the self-pour beverage wall to help. When they don’t have someone working the wall, there’s a notable drop in ticket average by $5.
As you can see from these Fireside Chats and key takeaways listed above, each operator analyzes the KPIs that best suit their business model. Your business should do the same. Make sure to look at the goals and objectives you want to achieve and then determine what KPIs you should analyze.

Sign up for our newsletter!
Your monthly guide to the latest self-pour resources and events.
Here When You Need Us!
If you have any questions about specific Key Performance Indicators for your establishment, self-pour technology, or any other general inquiries, please don’t hesitate to contact us at cheers@pourmybeer.com or (312) 416-9989.


